Sep 26, 2024
At ngrok, we manage an extensive data lake with an engineering team of one (me!).
This article is a look at how we built it, what we learned, as well as some selective deep dives I found interesting enough to be worth sharing in more detail, since they’ll bridge the gap between what people usually understand by the term “data engineering” and how we run data here at ngrok.
Some of this might even be useful (or, at the very least, interesting!) for your own data platform endeavors, whether your team is big or small.
Data we store
First of all, as an ngrok user, it’s important to understand what data we store and what we use it for, especially when talking about building a data platform. I want to be as transparent and upfront as possible about this, since talking about storing and processing data will always raise valid privacy concerns.
My colleague Ari recently wrote in-depth about what personal data of customers we store and you can always find up to date compliance data in our Trust Center.
What we store
But to give you a more concise overview, we generally store and process:
-
Data from our globally distributed Postgres instances, which contains customer data, such as account IDs, user to account mappings, certificates, domains and similar data.
-
Data from our metering and usage cluster which tracks the usage of resources.
-
Subscription and payment information (excluding credit card information).
-
Third-party data, such as support interactions from Zendesk.
-
Metadata about movement of events through the various components that make up ngrok’s infrastructure.
-
Purpose-built product signals, also as real-time events (more on those two later!).
Note that we do not store any data about the traffic content flowing through your tunnels—we only ever look at metadata. While you have the ability to enable full capture mode of all your traffic and can opt in to this service, we never store or analyze this data in our data platform. Instead, we use Clickhouse with a short data retention period in a completely separate platform and strong access controls to store this information and make it available to customers.
I hope this demystifies our data processing efforts a bit, so we can talk about the engineering side of things.
Why data engineering is different at ngrok (and probably not what you think)
We hired the first full time data person (it’s me!) in the summer of 2023. Before we filled that position, the data platform was set up by our CTO, Peter. Because of that, our data engineering (DE) team (or rather, our data role) is part of the Office of the CTO and effectively works horizontally across our engineering organization.
One artifact of having such a small team, our DE work is much closer aligned to holistic backend engineering work than the term “data engineering” often implies.
While I’m primarily responsible for the Data Platform and all associated services and tooling, I frequently find myself working on the actual ngrok products (as opposed to “just” the data lake). That includes architecture proposals and designs that span multiple teams and services and are mostly tangentially related to the “core” data work. And yes, I do write a fair bit of Go because of it.
As such, the majority of the data modeling work (i.e., SQL) is done by subject matter experts, which is very different to DE roles in many other organizations. In other words, I write very little SQL on a day to day basis and won’t usually be the person that writes a data model.
Within those subject matter experts, some people write reusable, well-structured dbt models, while other people focus on ad hoc analysis (based on these models) via our BI tooling in Superset. It’s worth noting that our entire organization has access to Superset and most data models and sources!
For instance, our growth team implements a huge amount of our actual data models and knows the business, product, and finance side much better than I do. They’re much better equipped to build sensible, complex, and maintainable data models that properly answer business questions.
In addition to that, we have a small-but-mighty infrastructure team that owns and operates our core infrastructure, such as Kubernetes, as well as the developer tools that are instrumental in keeping every engineering team (and, of course, ngrok itself!) running smoothly.
This particular setup—viewing DE as a very technical, general-purpose distributed system SWE discipline and making the people who know best what real-world scenarios they want to model—makes our setup work in practice.
Our data platform architecture
Now that you know how our (data) engineering org is structured, let’s talk about what we actually built and maintain and how it evolved over time.
ngrok as a product is a large, distributed, worldwide networking system with very high uptime guarantees, huge traffic volumes, and a large set of inherently eventually consistent (and often, ephemeral) data that can be difficult to interpret. Think about how a TCP connection works, and what steps are involved with making and routing it!
In other words, even our basic architecture was a bit more complex than “just copy your Postgres database somewhere to query it offline.”
ngrok’s data architecture in the past
Despite that, our original architecture was utilitarian and relied more heavily on AWS tools than our contemporary architecture, which is very open-source focused.
Its primary goal was to get the most important data sets we needed—Postgres, important external data, as well as some events—to effectively run finance reporting, abuse, and support.
On the batch ingestion side, we used Airbyte open source on Kubernetes to ingest third-party data via their respective APIs. We utilized the ngrok OAuth module to do authentication (as we do for all our open-source services that require an ingress controller).
Airbyte wrote JSON files, where we determined the schema with manual runs of a Glue parser and several Python scripts to create the target schemas, as well as another Glue job to write the target schema as Iceberg.
At the time, we did not have an orchestrator available and relied on Glue internal schedules. This meant we had no alerting or any integration with on-call tools.
We used AWS DMS here to get our core Postgres data, writing parquet data to S3.
This was a once-a-day batch job.
On the streaming side, we streamed event metadata via AWS Firehose, writing JSON data to 2 different S3 locations.
For analytics, all our data was (and still is) eventually stored as Apache Iceberg and generally queried via AWS Athena, although the legacy architecture did have some datasets that were based on raw JSON in the mix. We used AWS Glue as a meta store.
Our SQL models were actually SQL views directly in Athena, with no version control or lineage, that were directly created in production and queried via Preset (which is the managed cloud version of Superset).
Expensive queries and unreasonable models
Our eventing system, which is core to understand system behavior, relied on a very pricy AWS Firehose pipeline, as the way we split and organized events required us to both write JSON data (creating hundreds of TiB of data), as well as maintain data platform specific Go code in otherwise purely customer facing services (see the later section on Apache Flink, Scala, and Protobuf).
Some of the data became straight up impossible to query (or very expensive), as queries would time-out despite tuning with partitions and other tricks. The entire system was on borrowed time from the start.
It was also hard to impossible to reason about our models, since we lacked any of dbt‘s (or a comparable tool’s) creature comforts, such as lineage, documentation, version control, auditing, tests, and so on.
Without expecting you to be able to grok the details here, imagine getting asked why a certain field looks suspicious (if not to say, wrong), at the very end of this lineage tree:
…without having this lineage tree available, of course.
On a similar vein, not having a central orchestrator, alerting, and auditing for our data jobs was an operational challenge (you can learn more about how we solved those two issues here).
Our data stack was also not integrated very deeply in our Go monorepo and tooling, missing things like Datadog monitors and metrics, good test coverage, or style guides and enforcements via CI (see the Working in a go monorepo section).
Lastly (at least for the scope of this article), Airbyte and Glue have been a challenge to get right, but we’ll tell you how we did a few sections from now.
ngrok’s data architecture now
Our modern data platform is more heavily based around open-source tools we self-host on Kubernetes, dogfooding ngrok, with some AWS native tools in the mix.
To solve these challenges, a simplified, contemporary view of our current architecture looks like this.
All our batch ingestion is now run and orchestrated via Dagster, which I’ve written about previously. We still use Airbyte and still use ngrok to do so, but write directly to Glue and maintain our schemas as Terraform by querying the Glue API.
For streaming data (which is where most of our volume and complexity comes from), we now run Apache Flink to consume Protobuf messages directly from Kafka, rather than rely on Firehose and internal services. We’ll also cover this in more detail in a bit.
Our database ingestion is still using DMS, but now mostly relies on streaming writes, which are faster and more efficient (when responding to a support request, you don’t want yesterday’s data!).
For analytics, we heavily rely on dbt now, as well as self-host the open-source version of Apache Superset. We also added a hosted version of the dbt docs, of course also dogfooded behind an ngrok endpoint.
Technical deep-dives and problem-solving
While we cannot get into all the details of all the challenges we solved in the past 12 or so months, here are some challenges I found especially interesting as a software engineer.
Collaborating on data and infra in a Go monorepo
Most of ngrok’s code base is written in Go and exists in a monorepo. We run Bazel for build tooling, as well as Nix as a package manager. This allows us to have reproducible developer environments, as well as reasonably fast compile, build, and by proxy, CI times.
As most of our data infrastructure exists in Python and Scala, we had to adapt our workflow to this environment, as it is important to us to integrate the data environment with the rest of the engineering organization at ngrok.
Speaking from experience, having a completely separate data engineering team or department will eventually result in a fragmented engineering environment, with many bespoke paths that are not applicable to all team members, usually causing huge support and maintenance burdens on individual teams (e.g., maintaining two or more iterations of a CI/CD system).
Having one deployment system all engineers use is much easier and can be maintained by one infrastructure team:
I find this is often an artifact of the DE roles not being equipped with the necessary knowledge of more generic SWE tools, and general SWEs not being equipped with knowledge of data-specific tools and workflows.
Speaking of, especially in smaller companies, equipping all engineers with the technical tooling and knowledge to work on all parts of the platform (including data) is a big advantage, since it allows people not usually on your team to help on projects as needed. Standardized tooling is a part of that equation.
For instance, we have an internal, Go-based developer CLI, called nd, that does a lot of heavy lifting (think “abstract kubectl commands for half a dozen clusters”).
We also use it to run diffs between a developer’s branch and expected state, for instance to enforce formatting and code styles.
Our CI runners run NixOS.
So, for our data work, enforcing standards around dbt models involved a custom Nix package for shandy-sqlfmt, which we use as a standard for formatting all our dbt models, as well as integration into our nd tool, so developers (as well as CI) have access to nd sql fmt, just as they have nd go fmt.
While this does involve additional work for me, it ensures data tooling is never the “odd one out” and ramping onto data work (or vice versa) is much less of a cognitive shift.
Other integrations we’ve added over time include:
-
Bespoke, modern Python tooling (not only for our data tools), such as
poetryandruff, as well as enforcement of style and static analysis via CI. -
Smart
sbtcaches for Scala, since Scala + Bazel is not something we’ve explored in depth. -
Datadog monitors and metrics, including custom metric interfaces for all our data tools.
-
Integration in our on-call tooling, such as Slack alerts, OpsGenie integration, and others.
-
Various custom Nix derivations.
Wrestling schemas and structs between Airbyte and Glue
A more “data specific” challenge we’ve dealt with are complex schemas in Airbyte that often don’t match the actual data or are otherwise incompatible with our query engine, which is something I’m sure a lot of you are familiar with.
With a team of one, I can’t reasonably write individual jobs for individual tables or sources that handle all corner cases, as we simply have too large and diverse a set of data sources. Myself and others *have` to rely on code-gen and automated processing. This holds true for all data tools, not just Airbyte.
Originally, we wrote JSON files to S3, which supported the arbitrary data and schema changes that might happen, and ran AWS Glue crawlers on top of these files to detect the schema and create “raw” tables.
JSON is conceptually nice for this, since it can deal with arbitrary schemas. For example, using a parquet writer to S3 would rely on the source schema to be 100% accurate and has to deal with an array of limitations.
Glue crawlers, on paper, support table versions and table evolutions.
But we quickly realized that these crawlers were very unreliable, especially with changing schemas or differences between dev and prod.
This resulted in schemas that either couldn’t be queried outright or reported incorrect data.
We experimented with custom schema detection logic, which gave us more control over parameters like sample size, look back windows, and corner cases, but found that burdensome to manage, despite using existing libraries.
A part of this was AWS Glue’s odd way of storing structs, which are (deceptively so) depicted as arbitrarily deep JSON objects in the Glue web UI:
1{2 "payment_method_configuration_details": {3 "id": "string",4 "parent": "string"5 }6}Whereas the API describes these fields as:
1{2 "Name": "payment_method_configuration_details",3 "Type": "struct<id:string,parent:string>"4}Which includes describe table and show create table statements via Athena:
1CREATE EXTERNAL TABLE `...`(2 `status` string COMMENT 'from deserializer',3 `payment_method_configuration_details` struct<id:string,parent:string> COMMENT 'from deserializer',This very custom, bespoke way of describing structs meant that standard “JSON to JSON schema” parsers would not work out of the box.
While it is possible to work around some of this, this became a very convoluted problem, given that some AWS APIs are notoriously convoluted in themselves.
The Glue API expects the struct< syntax, for instance.
It’s also arguably not a problem we should need to solve.
So, we settled on using the Airbyte Glue destination connector, which would create the tables directly on Glue based on the reported schema of the source. This eliminates the additional hop (and point of failure) of running a crawler entirely and ensures we get at least a valid Glue table (albeit not necessarily a valid Athena table).
But it still does not solve the issue of fields being reported incorrectly at times, usually directly by the API.
For instance, the table stripe.charges cannot be queried due to Athena returning a TYPE_NOT_FOUND: Unknown type: row error.
Trying to get a DDL will yield a java.lang. IllegalArgumentException: Error: name expected at the position 204.
Keep in mind that this was entirely set up by Airbyte, with no human involvement or custom code run yet.
Position 204, for those that are curious, looks like this: total_count:decimal(38)>:boolean:struct<>:
This struct<> field can’t be queried in Athena.
To solve this, we now have a post-processing step that turns each struct field into a custom tree data structure, maps or removes invalid types at arbitrary depth (such as struct<>), and generates a terraform representation of each table, so we get uniform environments between dev and prod.
It also does an additional step by creating a flattened table that will map each nested field into a flat field with the appropriate type. We do this to maximize compatibility with Iceberg and make queries more ergonomic for users.
This works by querying the Glue API and some basic DSA. For instance, the following field might present as:
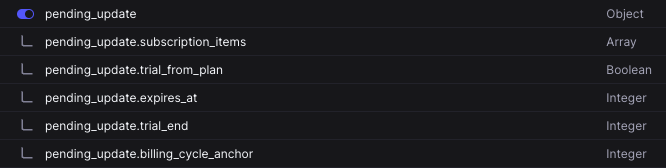
But really contain the following data, as reported to Glue (note the object under subscription_items):
1{2 "pending_update": {3 "trial_end": "int",4 "expires_at": "int",5 "trial_from_plan": "boolean",6 "subscription_items": [7 {8 "id": "string",9 "price": {10 "id": "string",11 "type": "string",12 // ...13 }14}If any of these fields is invalid, we map them to valid names or remove them.
For instance, a struct<> or simply a field that has a name that’s invalid in Athena, but valid in Glue).
Invalid names like "street-name" or "1streetname" need to be escaped with " in Athena, but cannot be used in nested fields, which are very common in JSON.
Airbyte also doesn’t have a bigint type, but Athena does; if a schema reports an Athena Integer type, we generally map it to a bigint to be safe, since a value >= 2^32 will cause Athena queries to fail.
We also normalize other types, such as decimal(38).
All of this results in parsed (stripped) tree similar to this, with types attached on the nodes:
Which we can now traverse and mutate, e.g. change names, types, or set deletion tombstones.
This would yield a field in the “raw” table as:
1columns {2 name = "pending_update"3 type = "struct<trial_end:bigint,expires_at:bigint,trial_from_plan:boolean,subscription_items:array<struct< //...As well as several fields in the target table, mapping the to aforementioned flat fields:
1columns {2 name = "pending_update_billing_cycle_anchor"3 type = "bigint"4 parameters = {5 "iceberg.field.current": "true",6 "iceberg.field.id": "67",7 "iceberg.field.optional": "true"8 }9 }This way, we reap several benefits:
-
We can rely on a provided schema by the source as much as possible by directly writing from Airbyte to Glue.
-
We have generated code that we can version control for both the raw as well as the target table.
-
We eliminate any potential differences between
devandprod, since we rely on the sources’ reported schema.
And, perhaps most importantly, it makes this process manageable for our specific team setup. Our next step is to terraform the entire Airbyte process.
While this is arguably just as complicated as running custom JSON schema parsers, we found that investing the time into building a proper data structure once and adjusting the ruleset where needed down the line was very much worth it, rather than trying to beat Glue crawlers or external JSON parser libraries into submission.
Scaling Apache Flink, Scala, and Protobuf to 650 GB/day
Another technically challenging, albeit interesting component, is our streaming integration with our core codebase.
We stream a subset of our Protobuf messages to Apache Iceberg via Kafka and Flink and make them available to query—in fact, it’s one of our core sources to fight abuse (more on that in a second).
Our Flink jobs are all written in Scala 3, relying on flink-extended/flink-scala-api.
Between our regular services, we interact via GRPC and talk Protobuf, which perhaps isn’t the most common format in the data world. However, hooking our data processing tools directly into Protobuf has several advantages:
- Protobuf’s schema evolution is one-directional; Apache Iceberg actually supports a lot more evolutions than Protobuf does, making sure our schemas stay in sync with the business’ schemas
- Old messages are always compatible with newer ones, meaning we never run into distributed ordering messages (i.e., processing a message with an old schema for a new table)
- Protobuf, albeit oddly opinionated, is relatively straightforward and has great Scala support via scalapb
- It’s a very efficient format on the wire, making it so that our pipelines can process tens or hundreds of thousands of events per second
Our main job consumes an average of ~9,000-15,000 events/s and at about ~691 bytes per message. Over time, this works out to roughly ~1,000,000,000 events or ~650 GB per day, split across ~55 message types, each with a different schema. Our other, more specialized streaming jobs are in the lower millions a day.
From a technical perspective, this was a fun challenge to solve.
We achieve the entire process by, in essence, sending a wrapper message called SubscriptionEvent that contains an EventType (an enum) that describes the content of the wrapper and a []byte field that contains the actual target Protobuf (one of the aforementioned 55 message types).
Newer pipelines skip that wrapper message, but this system predates the data platform.
- We generate all Protobuf Scala classes with some custom mappings to ensure all types are compatible with Iceberg (
one-ofs, for instance, are not!), usingscalapb. - We generate a slightly customized
avroschema (mostly to add metadata),serializers,deserializers, and so on, for each target message and store them as Scala objects (so this isn’t done at runtime).
In the pipeline:
- We read the raw wrapper message from Kafka.
- We split it by the
EventTypeand parse the target Protobuf type by parsing the[]bytefield on the message and yield an output tag to route messages by type. - We use previously generated
avroschema and use theFlinkWriterfor Iceberg to write the data, based on the job’s checkpoint interval.
Or, in Scala terms:
1pipeline[A <: GeneratedMessage: TypeInformation : EventTyper : SerializableTimestampAssigner : ProtoHandler]The combination of having nested messages and incompatible types made it impossible to use any of the built-in Protobuf parser that exist w/in the Flink ecosystem.
In fact, I had to customize scalapb.
One of the key elements in this is a typeclass called ProtoHandle that provides a ProtoHandle:
1trait ProtoHandle[2 A,3 B <: GeneratedMessage: EventTyper: AvroMeta4] extends Serializable {5 type ValueType = A6 def derivedSchema: AvroSchema7 protected def encoder: MetaRecordEncoder[A]8 def encode(msg: A, schema: AvroSchema, metadata: AvroMetadata): Record9// …10 }A ProtoHandle is a generic structure that’s responsible for schema parsing and encoding, for each Protobuf.
For efficiency reasons by front loading a lot of heavily lifting to compile time, we code generate all known ProtoHandles based on the enum:
1case object CAComp extends CompanionComp[CA] {2 private val T = CA3 private val coreSchema: Schema = AvroSchema[CA]4 private val schema: Schema = coreSchema.withMetadata5 private val enc: AvroEncoder[CA] = AvroEncoder[CA]6 private val ti: TypeInformation[CA] = deriveTypeInformation[CA]7 override val handle: ProtoHandle[CA, SubscriptionEvent] = SubscriptionEventProtoHandle(8 T.messageCompanion,9 schema,10 enc,11 ti12 )13}These objects (in Java terms, static) derive the avro schema using com.sksamuel.avro4s. AvroSchema, as well as the encoder using com.sksamuel.avro4s. Encoder, which uses magnolia under the hood.
We now have one correct, working avro schema + encoder for each possible Protobuf message.
Note: Some of the type signatures look a bit `wild*—that’s an artifact of the nested Protobufs and can only be partially simplified.
For instance, a
ProtoHandleneeds to know its own type (A) as well as its wrapper type (B) to correctly derive schemas and encoders, but for providing a concrete handler to a downstream implementation, we don’t need to know about the concrete type ofAanymore.
We also had to work around some other fun JVM limitations, such as
ClassTooLargeerrors, which did not make some of these class and type hierarchies easier to read.
This can be optimized, but this is also one of the results of a small team.
We can then expose this mapping as Map[FlinkEventTag, ProtoHandle[_, SubscriptionEvent]] to the job.
For each mapping, we can now:
-
Create the table or update its schema during the job’s startup by relying on Iceberg’s schema evolution.
-
Add a sink dynamically to a
Refof an incoming data stream.
Or, expressed in code:
1trait FlinkWriter[A, B: IcebergTableNamer] extends Serializable {2 // Builds/updates tables and returns a cached map of all remote schemas3 def buildTablesAndCacheSchemas(): Map[B, AvroSchema]4 // Sink assigner. Mutates the DataStream[A] ref5 def addSinksToStream(6 cfg: Config,7 schemas: Map[B, AvroSchema],8 env: Ref[DataStream[A]]9 ): List[DataStreamSink[Void]]10}Note: We do not (yet!) use an effect system and
Refis just a hint that we mutate a reference in a function:type Ref[A] = A.
Fighting abuse with meta signals
One of the ways we actually use this data is to understand, fight, and ultimately prevent abusive behavior like the state-sponsored Pioneer Kitten group.
While a lot of our processes around abuse detection are automated, some require human intervention.
Oftentimes, we’ll get abuse reports (via abuse@ngrok.com) and need to verify that these are accurate before we take action (such as banning an account). To do that, we can verify the reported abusive events match a certain account’s behavior on our platform.
If we suspect IP 198.51.100.1 to have hosted a phishing scam on port 443 via URL anexampleofabusewedontwant.ngrok.app on 2024-09-01, we can query our metadata similar to this:
1select case2 when event_type = 'ENDPOINT_CREATED' then 'created'3 when event_type = 'ENDPOINT_DELETED' then 'deleted' else 'unknown'4 end as action,5 account_id,6 event_timestamp,7 url,8 geo_location9from meta_events__audit_event_endpoint e10where account_id = 'bad_actor_id' and -- … other filtersThis will give us a full sequence of events, including what tunnels an account started, stopped, when, and from where. Based on this data, we can take action, such as suspending the account if the report is accurate.
On a similar note, in the event an account gets banned incorrectly and reaches out to our support team, they can query similar tables to do the same report in reverse and unban users.
Build your own ngrok data platform (or work on ours!)
While there are a lot of topics we didn’t cover in this article, I hope it provided both a good high-level overview about data engineering work at ngrok, as well as some details on specific challenges we faced and solved.
To do your own digging on ngrok data, try exploring event subscriptions or Traffic Inspector to get insight into your own traffic data flowing through ngrok.
Or, if you prefer to work on and with our actual data platform, we’re currently hiring a Senior Software Engineer, Trust & Abuse!
We’d love to chat about what additional challenges and improvement you’d want to dig into as an ngrokker. And, as always, you can ask questions about our data platform and beyond on our community repo.