Okta Webhooks
To integrate Okta webhooks with ngrok:
- Launch your local webhook.
npm start - Launch ngrok.
ngrok http 3000 - Configure Okta webhooks with your ngrok URL.
This guide covers how to use ngrok to integrate your localhost app with Okta by using Webhooks. Okta webhooks can be used to notify an external application whenever specific events occur in your Okta account.
By integrating ngrok with Okta, you can:
- Develop and test Okta webhooks locally, eliminating the time in deploying your development code to a public environment and setting it up in HTTPS.
- Inspect and troubleshoot requests from Okta in real-time via the inspection UI and API.
- Modify and Replay Okta Webhook requests with a single click and without spending time reproducing events manually in your Okta account.
- Secure your app with Okta validation provided by ngrok. Invalid requests are blocked by ngrok before reaching your app.
Step 1: Start your app
For this tutorial, we'll use the sample NodeJS app available on GitHub.
To install this sample, run the following commands in a terminal:
Loading…
This will get the project installed locally.
Now you can launch the app by running the following command:
Loading…
The app runs by default on port 3000.
You can validate that the app is up and running by visiting http://localhost:3000. The application logs request headers and body in the terminal and responds with a message in the browser.
Step 2: Launch ngrok
Once your app is running successfully on localhost, let's get it on the internet securely using ngrok!
-
If you're not an ngrok user yet, just sign up for ngrok for free.
-
Go to the ngrok dashboard and copy your Authtoken.
Tip: The ngrok agent uses the auth token to log into your account when you start a tunnel. -
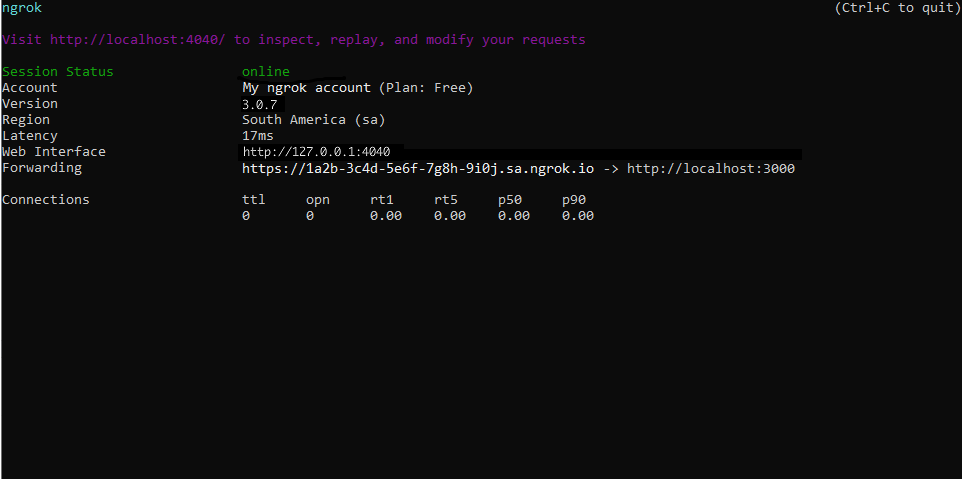
Start ngrok by running the following command:
Loading…
-
ngrok will display a URL where your localhost application is exposed to the internet (copy this URL for use with Okta).
Step 3: Integrate Okta
To register a webhook on your Okta account follow the instructions below:
-
Access yout Okta tentant (i.e.
https://mytenant.okta.com/) and sign in using your Okta account. -
On the left menu, click Workflow, click Event Hooks, and then click Create Event Hook.
-
On the Add Event Hook Endpoint page, enter
My Webhookin the Name field, and in the URL field enter the URL provided by the ngrok agent to expose your application to the internet (i.e.https://1a2b-3c4d-5e6f-7g8h-9i0j.ngrok.app).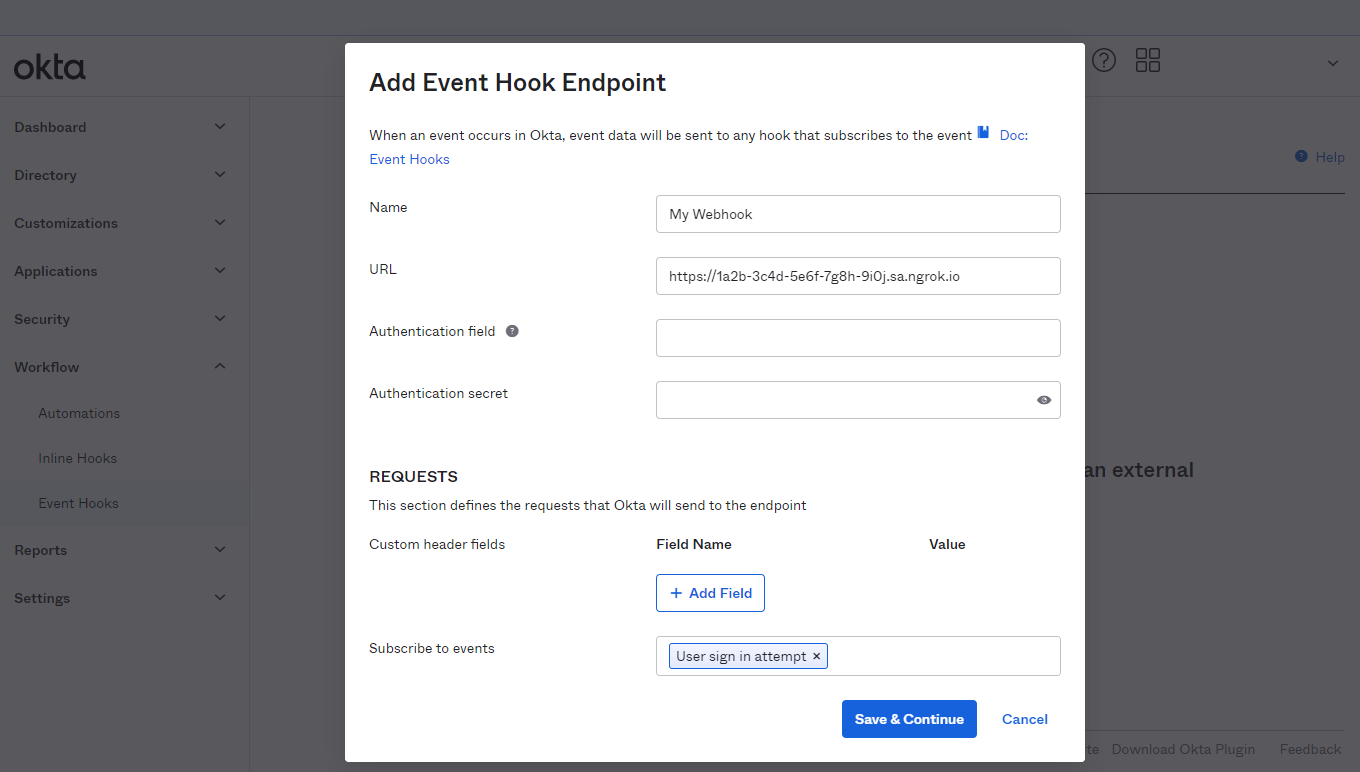
-
In the Subscribe to events field select User sign in attempt and then click Save & Continue.
-
On the Verification page, click Verify to confirme Okta can contact your localhost through ngrok.
Run Webhooks with Okta and ngrok
Okta sends different request body contents depending on the event that is being triggered. You can test your webhook by following the steps below.
-
On the Event Hooks page, click Actions for your webhook and then click Preview.
-
On the Preview page, select the Event Type from the list of event types and then click Deliver Request.
Confirm your localhost app receives an event notification and logs both headers and body in the terminal.
Optionally, You can trigger new calls from Okta to your application by signing out from Okta console, signing in again, and then clicking Admin to enter the administrative console.
Confirm your localhost app receives an event notification and logs both headers and body in the terminal.
Inspecting requests
ngrok's Traffic Inspector captures all requests made through your ngrok endpoint to your localhost app. Click on any request to view detailed information about both the request and response.
By default, accounts only collect traffic metadata to avoid exposing secrets. You must enable full capture in the Observability section of your account settings to capture complete request and response data.
Use the traffic inspector to:
- Validate webhook payloads and response data
- Debug request headers, methods, and status codes
- Troubleshoot integration issues without adding logging to your app
Replaying requests
Test your webhook handling code without triggering new events from your service using the Traffic Inspector's replay feature:
-
Send a test webhook from your service to generate traffic in your Traffic Inspector.
-
Select the request you want to replay in the traffic inspector.
-
Choose your replay option:
- Click Replay to send the exact same request again
- Select Replay with modifications to edit the request before sending
-
Modify the request (optional): Edit any part of the original request, such as changing field values in the request body.
-
Send the request by clicking Replay.
Your local application will receive the replayed request and log the data to the terminal.