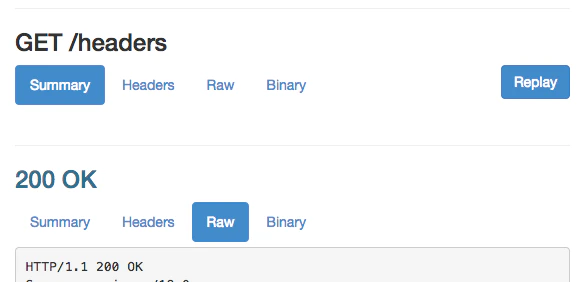
Inspecting requests
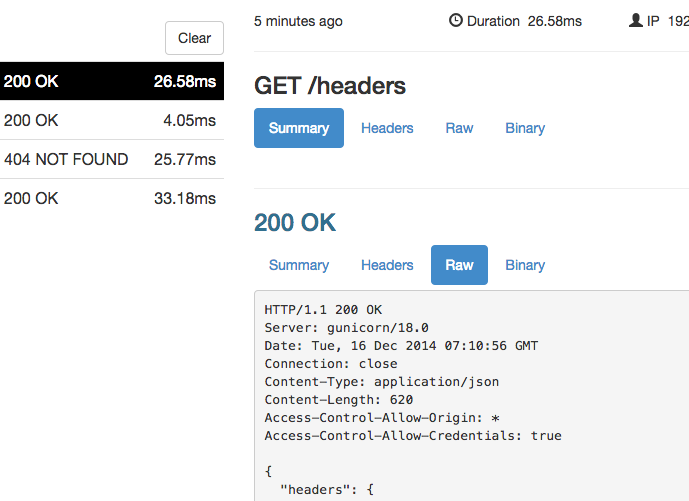
Every HTTP request through your endpoints will be displayed in the inspection interface. After you start the ngrok agent, open http://localhost:4040 in a browser on the same machine. You will see all of the details of every request and response including the time, duration, source IP, headers, query parameters, request payload and response body as well as the raw bytes on the wire. The inspection interface has a few limitations. If an entity-body is too long, ngrok may only capture the initial portion of the request body. Furthermore, ngrok does not display provisional 100 responses from a server. Inspection is only supported for HTTP endpoints. TCP and TLS endpoints do not support any inspection and will not show up in the inspection interface.Detailed introspection of HTTP requests and responses
Request body validation
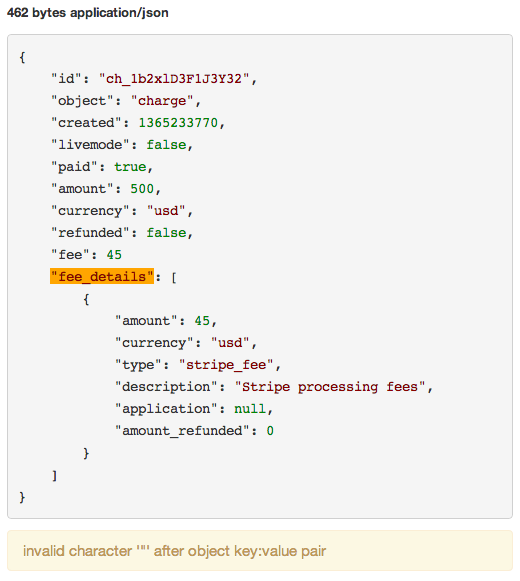
ngrok has special support for the most common data interchange formats in use on the web. Any XML or JSON data in request or response bodies is automatically pretty-printed and checked for syntax errors.The location of a JSON syntax error is highlighted
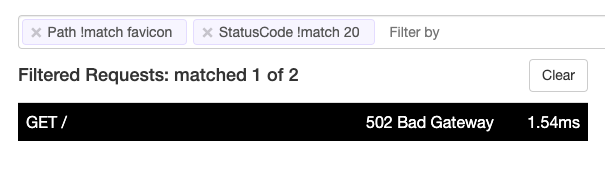
Filtering requests
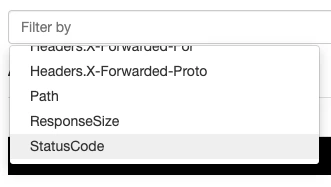
Your upstream service may receive many requests, but you are often only interested in inspecting some of them. You can filter the requests that ngrok displays to you. You can filter based on the request path, response status code, size of the response body, duration of the request and the value of any header.Click the filter bar for filtering options
Filter requests by path and status code
Replaying requests
Developing for webhooks issued by external APIs can often slow down your development cycle by requiring you do some work, like dialing a phone, to trigger the hook request. ngrok allows you to replay any request with a single click, dramatically speeding up your iteration cycle. Click the Replay button at the top-right corner of any request on the web inspection UI to replay it. Replay works via the local agent sending the request directly to your upstream service. As such, the replayed request will not be subject to any policies that exist on your Cloud Endpoint since those are applied prior to the request reaching the local agent. If you are interested in replaying the original request before the endpoint policies are applied and testing new policies, please use the Traffic Inspector in the ngrok Dashboard.Replay any request against your web server with one click
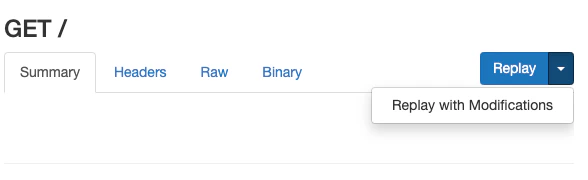
Replaying modified requests
Sometimes you want to modify a request before you replay it to test a new behavior in your upstream service.Click the dropdown arrow on the ‘Replay’ button to modify a request before it is replayed
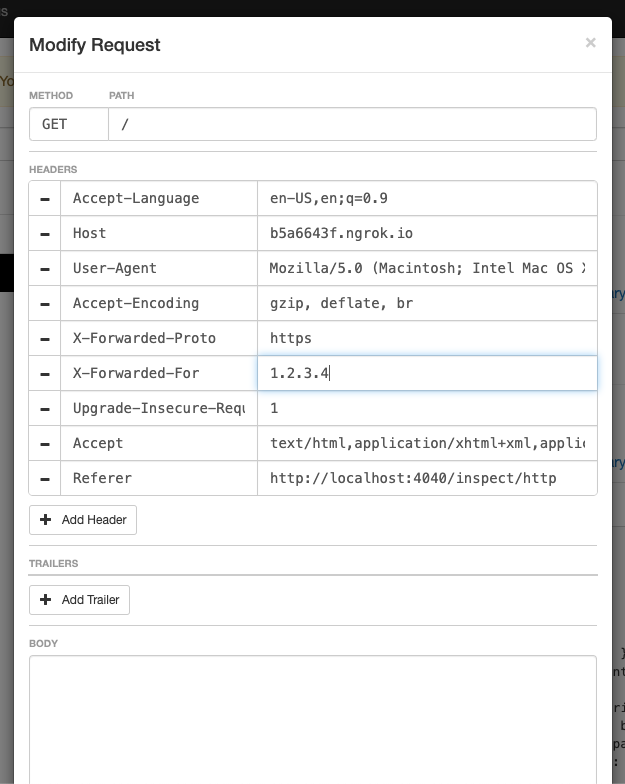
The request replay modification editor
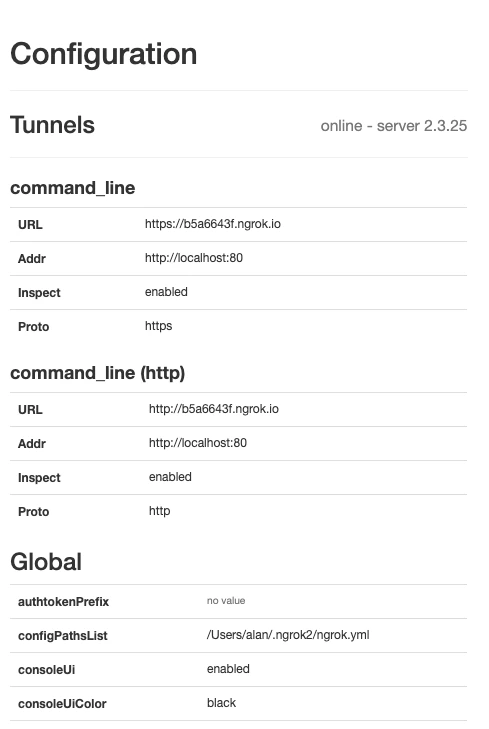
ngrok Agent status page
ngrok’s local web interface has a dedicated status page that shows configuration and metrics information about the running ngrok process. You can access it at http://localhost:4040/status. The status page displays the configuration of each running endpoint and any global configuration options that ngrok has parsed from its configuration file.Endpoint and global configuration
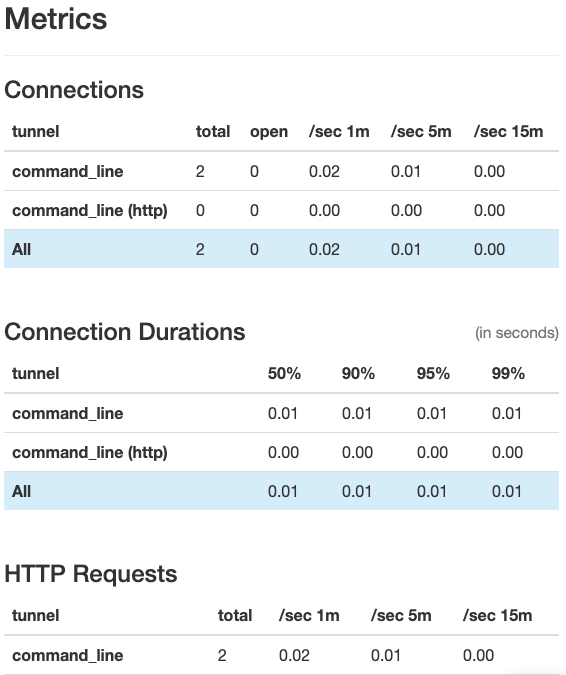
Endpoint traffic metrics