# See open TCP connections in Traffic Inspector, including the ones taking a nap
> Traffic Inspector now lists TCP and TLS connections while they're still open, shows how long each one has been idle, and graphs the bytes a connection moves over time.
- Date: 2026-11-16
- Shipped by: Ayden Adair and Jesse Snyder
- Products: Gateway
- URL: https://ngrok.com/changelog/traffic-inspector-open-connections
A database session that's been open for two hours could be busy, or it could be stuck. Traffic Inspector can now tell you which. Open TCP and TLS connections appear in their own list while they're still connected, with how long each one has been idle and a graph of its bytes in and out over time.
Until now, a connection showed up in Traffic Inspector only after it closed. A long Postgres session, SSH login, or MQTT client stayed invisible for as long as it was connected, which is exactly when you want to look at it.
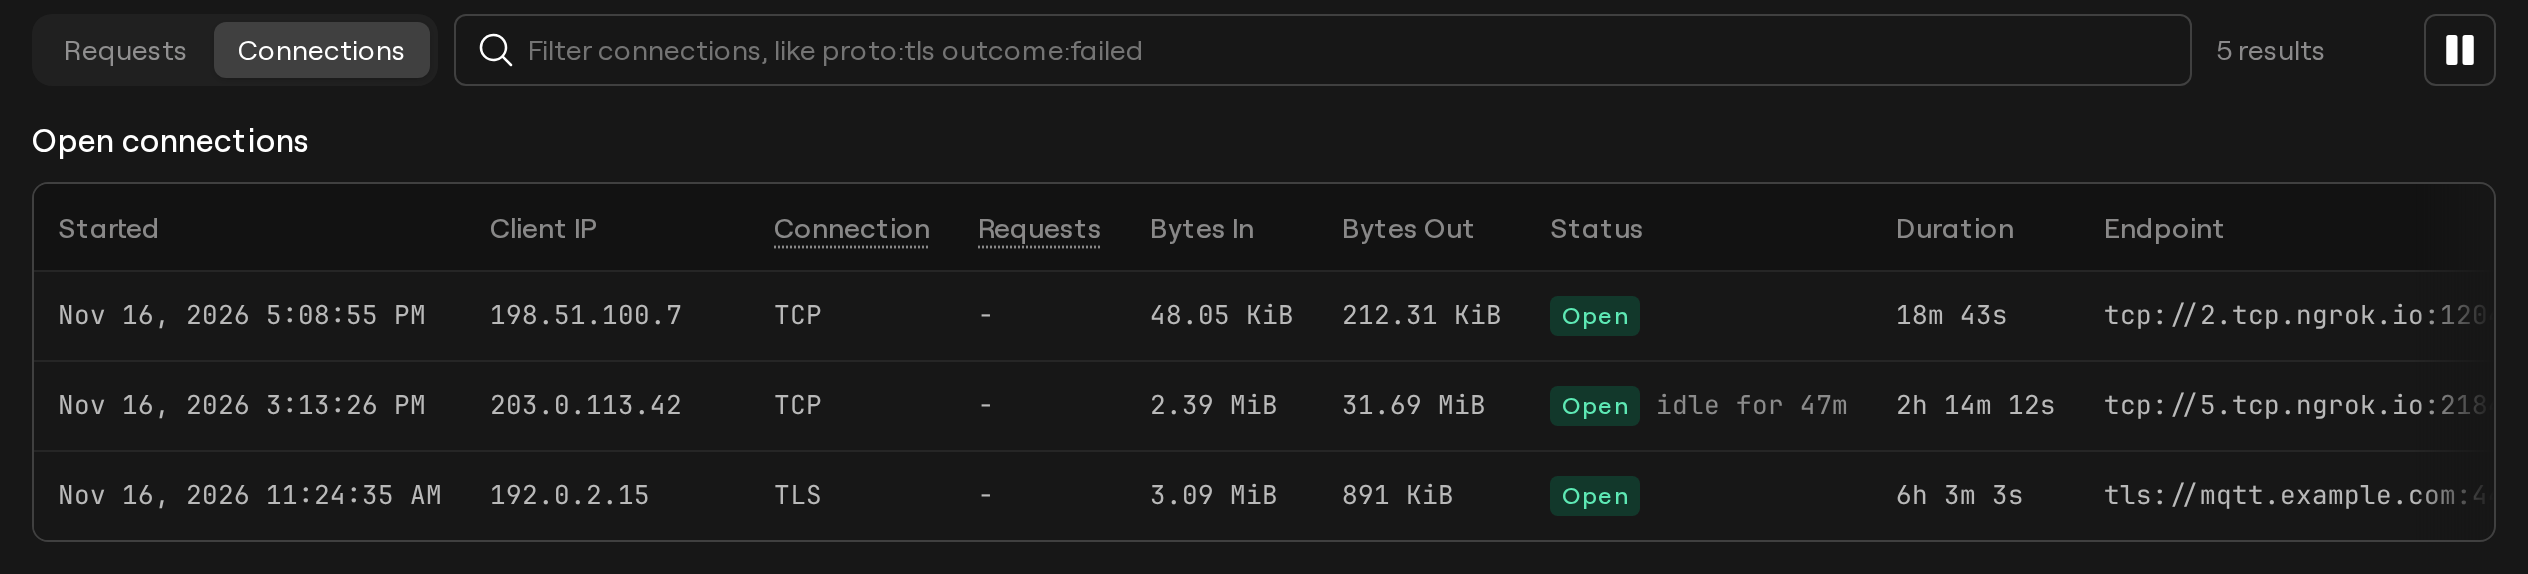
Say a Postgres database sits behind `5.tcp.ngrok.io:21843`, and you want to know whether the app server at `203.0.113.42` still uses the connection it opened. In this example, the SSH and MQTT connections are busy. The Postgres connection has been open for 2h 14m, but its **Status** reads **idle for 47m**. ngrok hasn't seen a byte in either direction for 47 minutes.
**Status** shows the idle time once a connection has moved no data for at least a minute. **Bytes In** and **Bytes Out** show the totals so far, and **Duration** counts up while you watch.
Select the connection to see when its data moved. Its details now end with a **Bytes over time** graph.
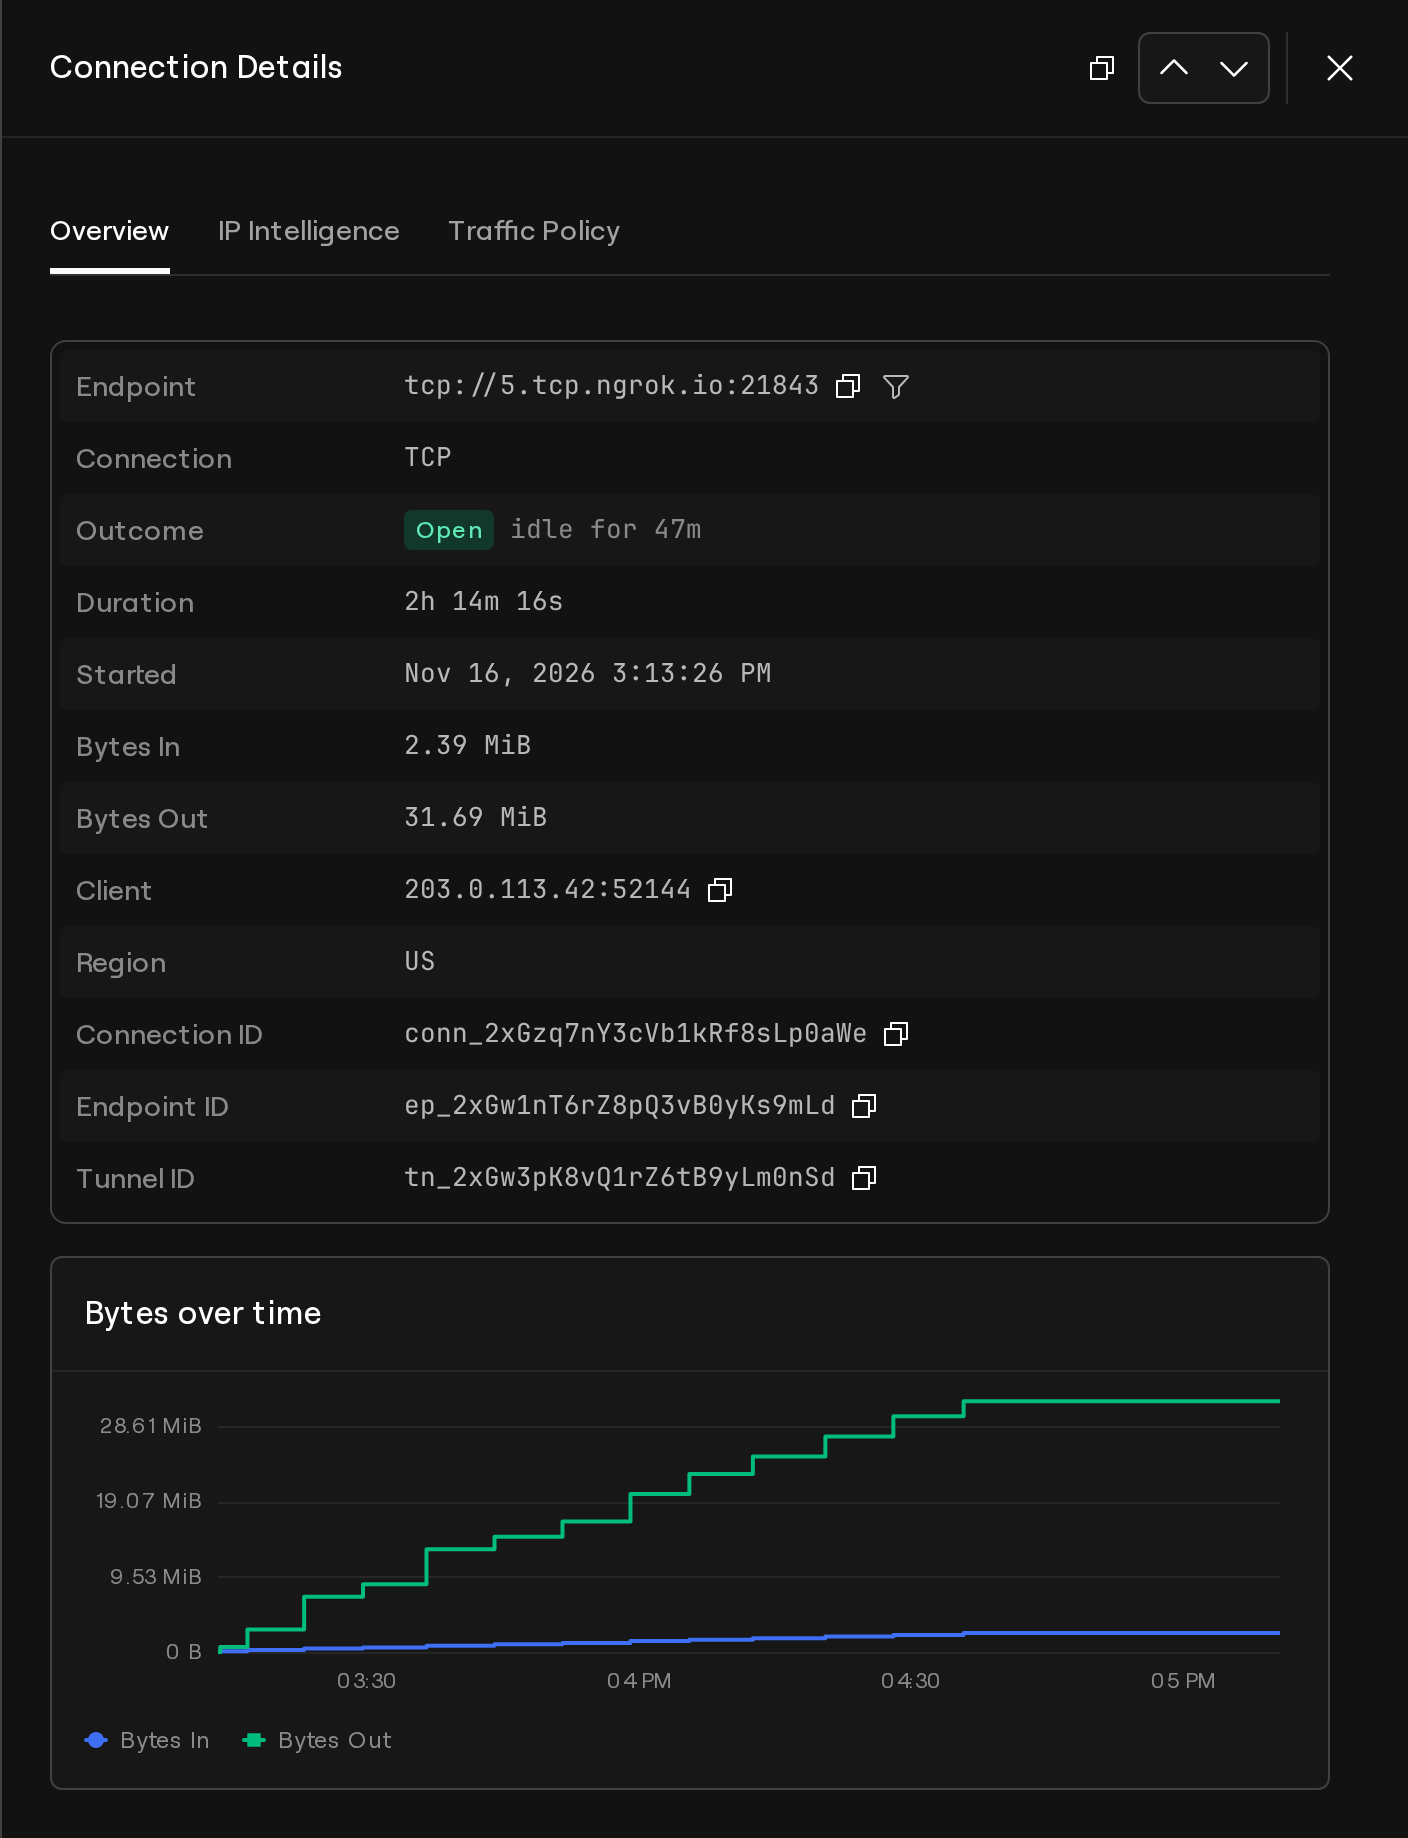
Here, bytes moved in both directions in steady steps for about an hour and a half. Then both lines go flat at the same moment and stay flat. The graph can't tell you why. Maybe the app forgot to close the connection, or maybe it's waiting on a query that never came back. Either way, you know which connection to chase, and when it went quiet.
Closed connections keep the graph too, as long as ngrok reported them at least once, so you can still see when a connection was busy and when it sat around. A very long connection shows its newest 2,000 reports, about 16 hours of steady traffic.
ngrok reports an open connection about every 30 seconds while it moves data and about every 30 minutes while it's idle. A connection appears in the list after its first report, so one that closes within a few seconds shows up only under **Closed connections**. For the same reason, the graph's lines move in steps rather than slopes. With live mode on, the open list and the graph refresh every 10 seconds.
The open list has a few limits:
- It shows TCP and TLS connections. HTTP and HTTPS connections still appear after they close.
- It shows up to 1,000 connections, the most recently opened first. Add a filter to find the rest.
- It uses the same filters as the closed list, except `outcome` and `error`. A connection that's still open has neither, so those filters hide the list.
- It ignores the time range, because an open connection is open now. A custom range that ends in the past hides the list.
Open connections are available on every plan. Retention counts from when a connection closes, so a connection that opened before your retention window still appears while it's open.
## Get started
[Sign in to ngrok](https://dashboard.ngrok.com/) or [sign up](https://dashboard.ngrok.com/signup), then [install the agent and add your authtoken](https://ngrok.com/docs/getting-started/). On the free plan, [add a payment method](https://dashboard.ngrok.com/settings#id-verification) before you start a TCP endpoint.
Forward a TCP service on your machine, such as an SSH server on port 22:
```bash
ngrok tcp 22
```
Connect with the host and port from the agent output, and leave the session open:
```bash
ssh @ -p
```
Open [**Traffic Inspector** → **Connections**](https://dashboard.ngrok.com/traffic-inspector/connections). Your connection appears under **Open connections** within about 30 seconds.
Select the connection, then type a few commands in your SSH session. **Bytes over time** steps up with each report. Stop typing for a minute, and **Status** starts counting how long the connection has been idle.
Disconnect from the SSH session. The connection moves to **Closed connections** and keeps its graph.
The [TCP connections docs](https://ngrok.com/docs/obs/traffic-inspection/tcp-connections) list every field, filter key, and limit.